

A Gantt chart is a work plan laid out on a timeline. Tasks appear vertically and dates horizontally; bars show when each stage starts, how long it lasts and when it ends. This format makes the order of work, parallel tasks and possible delays easy to see.
If you want to understand what a Gantt chart is and build one for a real project, start with a list of tasks and their dependencies. You can polish its appearance later. First, the team needs to agree on what must be done, in what order and who is responsible for the result.
Below is a step-by-step method, a renovation example, an explanation of dependencies and the mistakes that make a chart less useful.
Contents:
What is a Gantt chart?
A Gantt chart is a way to show a project as tasks on a calendar timeline. Each task has a start date, an end date and a duration. The longer the bar, the more time the work takes.
The chart answers five practical questions:
- What work is part of the project?
- When does each stage start and end?
- Which tasks can run in parallel?
- Which task is delaying the next one?
- Where is time contingency needed?
What goes into a Gantt chart?
A working chart is built from several elements:
- Tasks. Specific stages with clear results, such as finishing demolition, installing the electrical rough-in or approving plasterwork.
- Time scale. Days, weeks or months. A daily or weekly scale is convenient for a renovation.
- Duration bars. These show how much time is allocated to each task.
- Dependencies. These connect tasks when the next one starts only after the previous one is complete.
- People responsible. They clarify who confirms that a stage is ready and who handles a schedule change.
- Milestones. These mark important events: a materials delivery, stage acceptance or the opening of the next work area.
For your first chart, tasks, dates and the main dependencies are enough. Add owners and milestones after you have checked the logic of the project.
How to make a Gantt chart in seven steps
- Define the project result. Write down what must be ready by the final date.
- Break the project into stages. Use tasks with verifiable outcomes. “Electrical rough-in completed” is more precise than “work on the electrical system.”
- Put the stages in order. Separate essential sequencing from work that can happen at the same time.
- Estimate duration. Account for scope, crew size, deliveries and technical waiting periods.
- Assign dates and owners. Each task needs a start, an end and someone who updates its status.
- Connect dependent tasks. If a delay in one stage moves another, show that link on the chart.
- Check the chart with the team. Confirm worker availability, delivery dates and contingency at risky handoffs.
Update the chart on an agreed schedule: daily for a short project or weekly for a long one. When you move a date, record the reason and the new forecast.
How do task dependencies work?
A dependency explains why one task cannot begin before another. The most common case is a finish-to-start link: final finishing begins after the rough work has been completed and accepted.
Construction projects often have three typical situations:
- Sequential work. Demolition opens the area for rough-in services.
- Parallel work. Electricians and plumbers can work at the same time in separate rooms if the crews do not get in each other’s way.
- Technical waiting period. After screeding or plastering, time is needed before the next stage. The wait occupies space on the chart just like a task.
The chain of linked tasks with the least spare time has the greatest effect on the finish date. Check it whenever the schedule changes: a delay within that chain often delays the whole project.
A renovation Gantt chart example
Imagine a six-week apartment renovation. A high-level plan might look like this:
- Demolition and debris removal — 3 days. This opens the area for measurements and services work.
- Electrical and plumbing rough-in — 5 days. Two crews can work in parallel in agreed areas.
- Plastering — 7 days. This starts after concealed services are complete.
- Screeding and technical waiting period — 6 days. The next stage depends on the substrate being ready.
- Tiling and painting — 10 days. Some rooms can progress in parallel.
- Electrical and plumbing fit-off, then acceptance — 5 days. The final stage begins once surfaces and equipment are ready.
In this example, services work affects plastering, screeding affects finishes and equipment delivery affects the final installation. If a door or plumbing fixture arrives late, add the delivery as a separate task so the risk is visible before the installer arrives.
Common mistakes when making a Gantt chart
- Stages that are too broad. A task called “renovate the apartment” hides dependencies and makes the deadline hard to manage.
- Too much detail. Hundreds of tiny actions require constant maintenance. Group them into tasks with verifiable results.
- No technical waiting periods. Drying materials and waiting for deliveries take time on the schedule.
- No one responsible for updates. The chart becomes outdated after the first schedule change.
- Every task is linked rigidly. The team loses opportunities to work in parallel.
- The plan is not compared with actual progress. Update dates and the completion forecast regularly so the chart remains useful.
How can you use a Gantt chart in the 101 app?
In the 101 web app, work items from the price list and reports can be placed on a project timeline. The chart shows dates, amounts, assignees and weather. The team plans work using the same items it uses in estimates and reports, so there is less data to transfer manually.
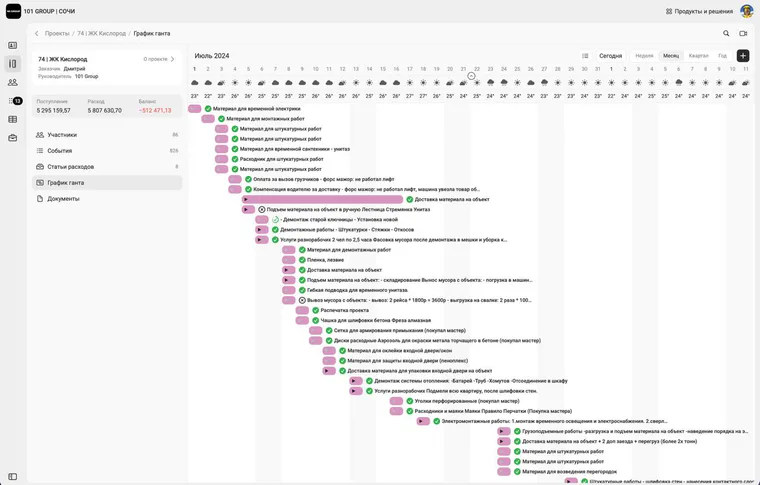
Once the work breakdown and dependencies are ready, follow the product guide: create a Gantt chart online in the 101 app (in Russian).