
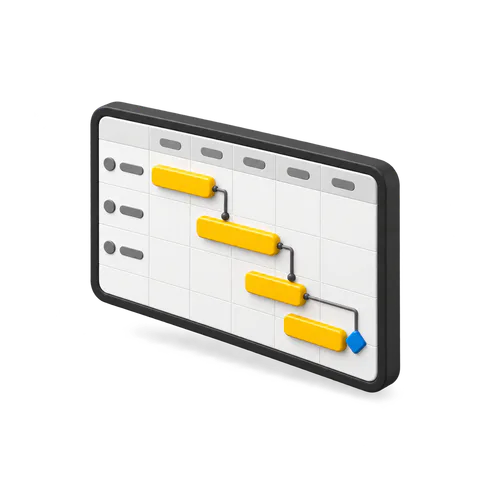

A Gantt chart is one of the few ways to keep project deadlines under control when many tasks depend on one another. One tradesperson falls behind, a delivery goes to the wrong address, or client approval slips by two days, and the whole plan starts to drift.
A task list offers little help here: it does not show which link in the chain failed or where the planned completion date became unrealistic. A Gantt chart puts dates, sequence, and dependencies on the same timeline.
Below we explain what a useful Gantt chart contains, how to keep it current without needless paperwork, who owns it, and where to maintain it so the team actually uses it.
Contents:
What is a Gantt chart?
A Gantt chart is a schedule that displays each task as a bar on a timeline. The left edge marks its start date and the right edge its finish date. In one view you can see which tasks run in parallel, which compete for the same resource, and which task must finish before the next can begin.
Dependencies are its main strength. In a renovation, electrical rough-in comes before plastering, plastering before painting, and painting before final installation. Without recorded dependencies, the schedule lives in the site manager’s head and in chat messages.
Milestones add another layer. Teams place them at moments such as “ready to show the client,” “ready for the next crew,” or “stage ready for payment.” These are events on the timeline and usually have no duration. If approval takes time, plan it as a separate task.
How do you read a Gantt chart and spot problems?
Once you have a chart, read it as a risk map. Watch for three things: overlapping work, bottlenecks, and tasks with no time buffer.
Tasks with no slack form the critical path. In conventional project scheduling, this is the chain of work with no time reserve that determines the project finish date. A delay in any task on that path moves the finish date as well.
Next, look for dependencies that were never recorded. A typical example: “lay tiles” is scheduled for Monday, but the tiles have not been purchased, delivery has not been arranged, and the base is not ready. On a Gantt chart it can appear as a neat bar with no real prerequisites.
Finally, examine buffers. With no reserve, any delay becomes an emergency. Set time reserves for the risks of each stage, such as weather, deliveries, and approvals. One universal percentage cannot replace that assessment.
How do you keep a Gantt chart up to date?
A Gantt chart stays useful only until the first unrecorded change on site. Maintaining it means setting an update rhythm and rules for changing the plan. If the schedule is updated once a month, it becomes an archive.
The basic rule is simple: record actual progress as work happens, and change the plan as soon as you know a deadline will slip. As we noted in our article on construction schedules, a fixed schedule becomes outdated quickly and needs regular updates.
A practical routine for maintaining a project Gantt chart is:
- Break the project into stages and major deliverables that can be accepted. Stages are easier to discuss with a client than hundreds of small tasks.
- Create tasks within each stage, with a duration and a clear outcome: what exactly must be ready.
- Record task dependencies so the sequence of work is visible.
- Assign an owner to each task. Responsibility should be explicit even if you keep the chart mainly for yourself.
- Add time buffers where delays recur, such as deliveries, wet trades, and approvals.
- Agree on an update rule: close out actual work daily or at the end of a shift, and recalculate the plan weekly.
- Keep a change log: what changed, who approved it, and how dates moved. It helps settle disputes about what was agreed.
Agree separately on what “done” means. People may use different completion criteria for tasks such as electrical rough-in or kitchen installation. On a Gantt chart this creates an illusion of progress: the bar is complete and the next stage starts, while unfinished work remains.
Who should own the Gantt chart?
There should be one person accountable for the chart. This schedule owner maintains its structure, checks dependencies, and approves plan changes. In renovation projects, that is often the project manager or site manager.
The owner does not have to enter every update personally. Our article on introducing project management systems makes a useful point: appointing one person to “maintain the system” while everyone else merely watches creates a tidy display without real progress data. On a building site, shared reporting works better: each person records their part and the manager reviews the whole picture.
Four roles are usually enough to make responsibilities clear:
- Schedule owner: sets the structure, dependencies, and milestones, and approves changes to the plan.
- People doing the work: mark tasks complete based on actual progress and add a short note when a deadline slips.
- Purchasing and supply: confirm delivery dates and material readiness because task starts depend on them.
- Client, when involved: confirms decisions about changes and revised dates so agreements stay clear.
Ask the team who will update the schedule if you learn today that materials will arrive in three days. If nobody can answer, responsibility is unclear and the chart will drift away from what is happening on site.
Where should you keep it: spreadsheets or software?
Gantt charts are available in different tools. A work schedule can also be a table, Kanban board, or calendar. Whatever view you choose should connect work to time and show the sequence and dependencies.
If the schedule is an attachment to a contract, teams often use Excel or Numbers to list tasks, dates, and owners. If they use it to manage daily work, a planning tool makes it easier to record status and change dates without rebuilding a file.
Common choices include:
- Spreadsheets such as Excel and Numbers for a fixed plan or a contract attachment.
- Notion for a Gantt-style timeline and collaboration when you want a shared workspace with a flexible structure. We have also written an introductory guide to Notion.
- Task trackers for tasks, statuses, and accountability, with a Gantt view as one of several views. Our guide to choosing a project management system (in Russian) discusses this choice.
- Planning software such as Microsoft Project when network schedules, the critical path, resource planning, recalculated dates, and complex dependencies matter.
When evaluating a tool, check whether people can record progress from a phone, connect dependent tasks, move downstream dates when a deadline changes, and give external contractors access without friction.
How do you connect dates with work and money?
Dates are closely tied to work completed and money: what has been done, paid for, purchased, or paused while an advance payment is pending. Construction teams often combine a Gantt planning tool with a separate tool for finances and documents.
The web version of the 101 App has a Gantt chart. You can add work from a project price list and reports, place it on a timeline, and link it to dates, assignees, and weather. The balance report adds a financial plan-versus-actual view. The workflow is described in Gantt chart in the 101 App.
A weekly review of these two layers helps answer many questions at the end of a project. In the Gantt chart, record the planned dates and changes. In the financial view, record actual expenses, advances, payments, and supporting documents. Then a conversation with the client about a revised finish date has a factual basis: what is done, what awaits delivery, and what needs approval.
For a closer look at construction scheduling, see how to create a construction schedule and our guide to scheduling construction work.
A Gantt chart gives a project a visible route. One person maintains its logic and agreements; the team records actual progress. Choose a tool that people really update and use to make decisions.