

Commercial real estate market analysis is useful in two situations. First, when you need premises for a business: you want to understand a reasonable price in your location, vacancy risks, room for negotiation, and the budget for fit-out and relocation. Second, when you assess a property as an investment or development project and need to connect rent, vacancy, marketing time and financing costs in one model.
The practical approach below explains what data to collect, which metrics to calculate, where cause and effect are often confused, and how to turn findings into decisions.
Contents:
Why analyse the market?
Commercial property can look simple: find premises, sign a lease and operate. In practice, the same address may be excellent for a shop and unsuitable for a service business. A warehouse with a low headline rent can be expensive because of logistics, access restrictions and engineering requirements. An office in a suitable district may outperform a cheaper one by saving staff time and helping recruitment.
Analysis produces three outcomes: a range of negotiable terms—rent, rent-free periods, term, deposit, indexation, fit-out and engineering responsibilities; an understanding of real tenants or buyers, what they pay for and why they leave; and a risk map showing what would make the property's economics stop working.
Segments and market boundaries: what can you compare?
Offices, warehouses, shopping centres, street retail, hotels, light industrial premises and units in residential developments follow different rules. Within each segment, classes, districts, formats, engineering requirements, transport access and uses create further submarkets.
Suppose a company needs 300–500 m² of office space. Mixing central and peripheral locations, classes A and B, and standalone historic buildings produces an average rent that describes no actual property. Use one segment, one format and one tenant-selection logic to define a comparable sample.
Geography matters too: warehouses depend on routes and time to major interchanges; retail on the surroundings and pedestrian traffic; offices on transport, parking, infrastructure and the district's standing. Even “Moscow” contains several distinct local markets.
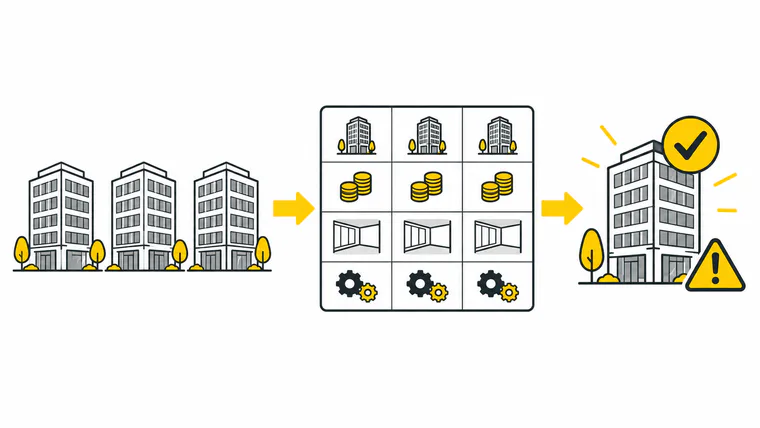
Comparable properties → consistent comparison terms → selection with risk assessment. This diagram explains the method; it contains no actual prices or market figures.
Metrics you need for a useful analysis
- Stock: how much suitable space exists, what quality means for your task, and how much is occupied.
- New completions and pipeline: what will reach the market in 12–36 months, for lease or sale, as shell and core or fitted space.
- Take-up: space actually leased or bought during the period, by whom and in which formats.
- Vacancy: available space as a share of the stock and its changes; include subletting when material.
- Rent: asking and effective rent, allowing for rent-free periods, discounts, operating expenses (OPEX) and lease terms.
- Cost of capital: financing costs and required returns for investment or development.
Two common mistakes are treating asking rent as effective rent and comparing leases with different payment structures. A quoted “net” or triple-net rent differs from one that already includes operations, security, marketing charges or parking.
Where to find data and how to check the figures
Use three layers: public research and consultants' reports for trends, vacancy ranges and rent movements; your own listing dataset for current asking supply; and conversations with brokers and owners to understand actual negotiation and concessions in your format.
Break down every quoted price: is VAT included, are OPEX included, are there rent-free periods, who pays for fit-out, what is the term and indexation, and are utilities capped? These terms can affect economics more than a difference of a thousand roubles per square metre.
Investment analysis also needs actual rent collection, marketing time, repairs between occupiers, management costs, insurance, taxes and capital repairs. Treat individual properties as projects. See financial tracking when you have several properties (article in Russian).
Public data examples from 2026
These dated Russian snapshots show how to read sources. They are not universal benchmarks for another city or country. Periods, territories and methods differ; you cannot combine them into a single ranking.
Offices, Moscow, 1 July 2026. The Moscow Analytical Centre (Russian) publishes NF Group data: class A vacancy 9.3%, class B vacancy 4.9%, with annual rents of 35,571 and 26,569 ₽ per m² respectively. Keep the date, class and unit of measurement; check payment inclusions separately.
Warehouses, Moscow region. The NF Group release published by Retail.ru on 19 March 2026 (Russian) gives a preliminary first-quarter estimate: vacancy including subletting 6.1%; weighted average asking rent for class A dry warehouses 10,500 ₽ per m² per year, excluding VAT and operating expenses. This is an asking rent, not the verified price of every transaction.
Shopping centres, Moscow, first quarter of 2026. CORE.XP research dated 31 March 2026 (Russian) reports vacancy of 5.7%. The figure covers Moscow shopping centres, not all retail real estate.
Street retail, Moscow, first half of 2026. The NF Group release published by Retail.ru on 8 July 2026 (Russian) reports average vacancy of 6.5% on the main retail corridors. Its sample differs from the shopping-centre study.
Investment, Russia, first half of 2026. CMWP's publication of 23 July 2026 (Russian) estimates commercial property investment at 286 billion ₽. Its method excludes purchases for owner occupation and properties for residential redevelopment. The Metropolis transaction is excluded because ownership actually changed in the first quarter of 2024. This is a Russia-wide investment measure, not Moscow-only transaction volume.
Segments may be in different phases. A broad commercial-property forecast is less useful than analysing your chosen format, location and comparable terms. For your own market, use current local sources and do not automatically transfer Russian rents, taxes or percentages.
How to keep the results useful
Even excellent analysis loses value if you stop tracking performance after the deal. A tenant's actual occupancy costs can exceed the estimate; an owner can face declining rent collection and longer vacancies. Regularly monitor expenses and profitability by property. For a portfolio, separate fixed and variable costs to understand minimum expenses and how they change. See how to calculate fixed costs (article in Russian).
Record income and expenses by property, monitor profitability, compare plan and actuals, and define payment and team-responsibility rules. For the metrics, see how to calculate profitability.
A property can be treated as a separate project. The 101 app supports income and expense tracking for projects involving premises, repairs or relocation. This helps compare the financial plan with actuals; the market model and lease terms need separate checks.
To understand your situation and the figures needed for your segment, start with a short product presentation and an explanation of financial tracking. This can help you structure the data for analysis.