

AI for financial analysis changes how managers work with management accounts. Instead of opening a complicated application, finding a report and rebuilding filters, a manager can ask in ordinary language: “Show the trend in receipts and payments over 12 weeks”, “Which project is eroding our margin?” or “What would happen to the company’s money if we closed today?”
MCP 101 connects an AI agent to authorised data in the 101 app. The agent retrieves facts, groups them around a specific question and returns an explanation, table or chart. In this sense, MCP 101 acts as a digital finance director: it assembles the management briefing the company’s situation requires.
Contents:
Why do universal charts fall short?
The same chart may answer one manager’s question and be useless to another. One company needs the weekly pattern of customer payments; another needs to understand a cash shortfall; a third needs margins by project manager or outstanding accountable advances.
You could draw another hundred dashboards and add, to exaggerate, 100,500 switches, yet still force people to adapt to someone else’s logic. The problem is not a shortage of charts. Each company has its own projects, cost categories, roles, revenue recognition rules and management questions.
We therefore chose an approach that gives the agent access to structured 101 data. The manager describes the situation, and the system assembles the view that this particular company needs.
How does AI analyse finances through MCP 101?
The connection works in five steps:
- You state the question and specify the period, company, projects or breakdown you need.
- The AI agent selects MCP 101 tools and clarifies missing parameters.
- 101 checks the user and returns only data that user can access.
- The agent groups the facts, applies an agreed formula and builds the answer.
- You receive a conclusion, table, chart or link to a generated document and can immediately ask a follow-up question.
MCP itself is not the analyst. It is the channel to data and tools. For a simple explanation of the technology, read What is MCP in simple terms? A practical overview of working with companies, projects, tasks and documents appears in AI agents for business.
What can you ask a financial agent?
The following request types can be assembled from the available MCP 101 tools.
| Manager’s question | What the agent checks | Possible answer |
|---|---|---|
| Show receipts and payments by week for the last 90 days | Financial events in the period, their types and dates | A line chart, totals and weeks with negative cash flow |
| Which projects made the most profit, and which made a loss? | Revenue, expenses and balances of accessible projects | A project ranking and an explanation of the main deviations |
| Which cost categories exceeded the estimate? | Estimated and actual amounts by project cost category | A planned-versus-actual table and a chart of the largest overruns |
| Who owes the company, and whom does the company owe, if we close today? | The closing balance, receivables, payables, accountable advances and own-funds balances | A summary of obligations with key amounts and risk areas |
| Which contractor has the largest unconfirmed or accountable balance? | Participants’ balances across projects and the company fund | A sorted list and details for the selected counterparty |
| Why did the margin fall compared with last month? | Comparable revenue and expenses by period, project and cost category | Change drivers: revenue, direct costs, overheads and the project mix |
You can continue the conversation: exclude archived projects, retain one manager, change the period, show only confirmed events or break the result down by category. Analysis becomes a dialogue instead of a static page.
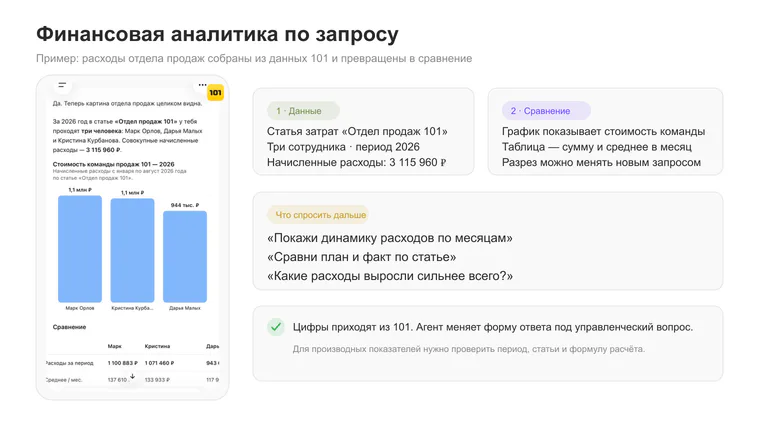
This is a real Russian-language screenshot of ChatGPT analysing a sales department’s expenses using 101 data.
How can you produce P&L, cash flow and EBITDA?
P&L: did the company earn a profit?
P&L is the profit and loss statement. It answers “How much did the company earn during the period?” Cash balances in accounts are a separate measure. For a management P&L, the agent needs revenue and expense recognition rules, correct allocation across projects and a distinction between direct costs and overheads.
Example request: “Prepare a management P&L for July by project. Show revenue, direct expenses, gross profit, overheads and the bottom line. Explain the three main deviations from June separately.”
Cash flow: where did the money come from and go?
A cash flow statement shows actual receipts and payments during a period. Through MCP 101, you can request financial events filtered by dates, projects, cost categories, participants and statuses, then group them by day, week or month.
Example request: “Build a 13-week cash flow statement from actual movements. Highlight weeks with negative net cash flow and list the largest payments.” The basics and the distinction between cash flow and profit are covered in the cash flow statement article (in Russian).
EBITDA: profit before interest, income tax, depreciation and amortisation
EBITDA is profit before interest income and expenses, income tax, depreciation and amortisation. Other taxes are not automatically excluded. The calculation starts with net income; because of non-operating items, the measure does not necessarily reflect core operations alone. You cannot obtain a reliable EBITDA figure with a single click if the company’s categories are not configured or some data is kept outside 101.
Example request: “Calculate preliminary EBITDA for the quarter. Show the starting net income and the adjustments for interest income and expenses, income tax, depreciation and amortisation. List separately the data missing from a substantiated calculation.” If the necessary categories are missing, the agent should request them or clearly mark the figure as preliminary. The formula and limitations are explained in What is EBITDA? (in Russian).
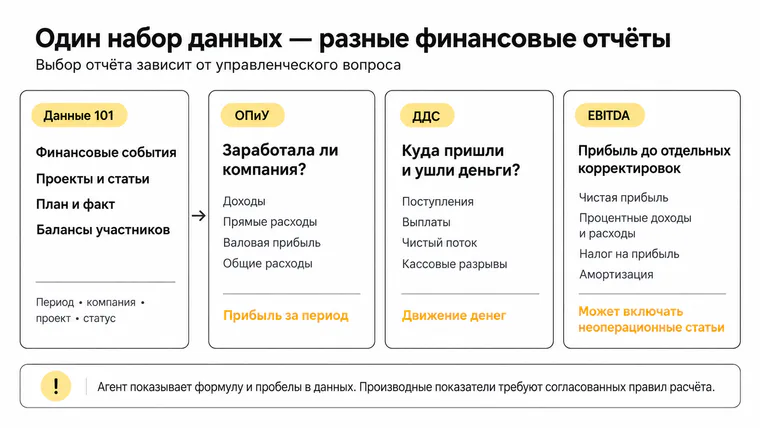
The Russian diagram contrasts the same three views: profit from recognised revenue and expenses, actual cash receipts and payments, and net income adjusted for interest income and expenses, income tax, depreciation and amortisation. Other taxes are not automatically excluded; EBITDA may include non-operating items.
How can you build charts on demand?
Start with the management question and choose a chart to match. To see a trend, the agent builds a line chart. To compare projects, it uses bars. To understand the expense structure, it shows shares or a sorted chart. If data is limited or a visual would hide an important detail, the agent returns a table and a short explanation.
For example, “Show how the share of materials expenses changed for each active project over the last six months” specifies four parameters: metric, breakdown, filter and period. The agent retrieves 101 events, groups expenses by category and project, calculates shares and builds the chart within the working conversation, if the chosen agent interface supports visualisations.
This does not mean creating arbitrary analysis from nothing. You can build any justified view for which 101 contains accessible data and there is a clear calculation rule. If data or rules are missing, the agent must identify the gap. Inventing numbers is unacceptable.
How can you schedule a daily financial briefing?
MCP 101 can also support recurring requests. In an agent environment that supports scheduled tasks, a regular run can retrieve fresh 101 data in the morning, compare it with the previous period and send a briefing. OpenAI’s official documentation describes background and recurring scheduled tasks that can use the connected tools and plugins available to the particular chat.
Example instruction for the schedule:
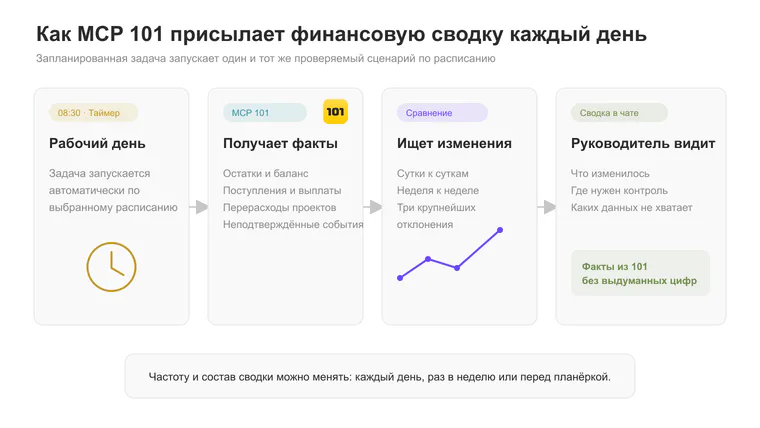
The Russian diagram shows a scheduled request, retrieval of 101 data through MCP, and preparation and delivery of the financial briefing.
In this way, MCP 101 becomes a regular digital finance director: it delivers the selected briefing on schedule without a separate request from the owner. You can change the frequency and contents, whether daily or weekly. For the schedule to run, the agent environment must be available, the 101 connection must be active, and the user’s permissions must allow the required requests.
Limits and verification rules
Analysis quality depends on accounting quality. If expenses have not been entered, events are unconfirmed or categories are used inconsistently, the agent will process an incomplete picture quickly. Specify whether to include unconfirmed transactions, which projects to include and which rules to use for the measures.
- Check the period, currency, company and project list.
- Separate actual cash movements from accrued profit.
- Ask for the formula and source amounts behind derived measures.
- Require missing data and unconfirmed events to be identified.
- Do not treat a forecast or preliminary calculation as financial statements.
Permissions remain with 101. The agent sees only companies, projects and events available to the user. The guide to management accounting in 101 (in Russian) explains how to configure the underlying records.
Where should you start?
- Connect MCP 101 using the current Help instructions (in Russian).
- Check the user and list of accessible companies.
- Ask one read-only question with a specific period and project.
- Reconcile the source amounts with 101 and agree on the formula.
- Ask for a different breakdown and an appropriate chart.
- After several checks, set up a recurring financial briefing.
Do not begin by trying to build a huge universal dashboard. Start with a decision you need to make today: where the margin fell, who holds accountable advances, which project exceeded its estimate or when a cash shortfall might occur. That is management accounting on demand: the analysis takes shape around a real question from a particular company.