

Housing prices rarely move in a straight line. The market may pause in spring and accelerate again towards year-end. Meanwhile, the news discusses mortgages, the key interest rate, discounts and instalment plans. This can make ‘housing prices’ seem to exist on their own, without explanation.
This is a historical examination of the Russian market in 2024–2025: statistical sources, differences between listings and transactions, and a chart based on Sberbank mortgage transactions. The figures and forecasts apply to Russia and the stated periods, rather than other countries or the current situation.
Contents:
- What happened to housing prices in 2024–2026?
- Where can you find figures, and why do sources disagree?
- Price chart: new-build and resale housing, based on transactions
- What drives housing price trends?
- What could happen in 2026–2027?
- How can you use price trends in decisions and calculations?
- Sources and studies
What happened to housing prices in 2024–2026?
In 2024, Russia's market adjusted to expensive mortgages: some demand shifted to purchases without loans and to instalment plans. According to DOM.RF data reported by RBC on 24 January 2025, new-build prices rose by 9.2% in 2024 against inflation of 9.52%: the nominal increase left real prices almost unchanged.
New-build price growth slowed in the first half of 2025: the DOM.RF index rose by 1.1% in March, 0.5% in April and 0.06% in May. The January–May increase was 2.95%. These are different intervals of one index, not statistics covering all transactions.
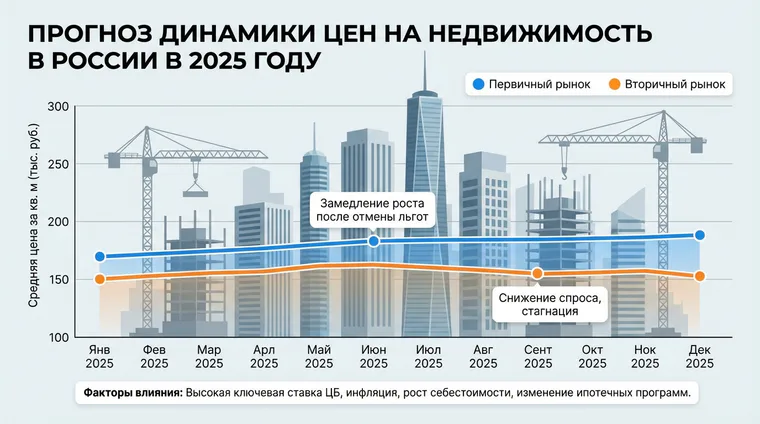
Illustrative forecast with Russian labels: its lines and numerical scale are not verified statistics. Actual values appear in the following chart and sources.
The picture became more active again towards the end of 2025. Changes to Russia's family mortgage programme were being discussed, demand for new housing accelerated, and transaction price growth followed. December transaction statistics illustrate this: monthly increases in both new-build and resale housing were noticeable in December 2025.
Where can you find figures, and why do sources disagree?
Consider a hypothetical example: a flat seller sees rising listing prices, then a different trend in transaction statistics. This does not necessarily mean the data are wrong: different measures are being compared.
To understand housing price trends, first choose the type of data:
- Transactions (actual deals): the average price per square metre in completed transactions within a particular sample. In the study below, this means Sberbank mortgage transactions in both markets.
- Listings (seller expectations): asking prices can differ from transaction prices and follow their own pattern. The difference is not always positive: in some regions, transaction prices in the study exceeded asking prices.
- Official indices: Rosstat publishes new-build and resale housing price indices for the regions of the Russian Federation. These help compare regions and quarters.
- Industry indices: DOM.RF maintains an index for the new-build market and regularly comments on growth rates.
Another reason for differences is that an ‘average price’ responds to the mix of transactions. If higher-end properties or higher-priced regions account for more deals in a particular month, the average rises even when movement within each segment is modest.
Price chart: new-build and resale housing, based on transactions
The chart below uses the Russian sample of Sberbank mortgage transactions in the new-build and resale markets from Domclick and SberIndex studies. In December 2025, average prices were respectively RUB 182.6 thousand and RUB 120.6 thousand per m²; monthly growth was 1.5% and 1%, and annual growth 7.3% and 8.2%. November's new-build price, RUB 179.9 thousand, is an observed point. November's resale value of RUB 119.4 thousand is calculated as 120.6 / 1.01. December 2024 values are approximate calculations: 182.6 / 1.073 ≈ 170.2 and 120.6 / 1.082 ≈ 111.5 thousand rubles. These are reconstructed reference values from rounded growth rates, not separate observations; the chart does not cover all market transactions.
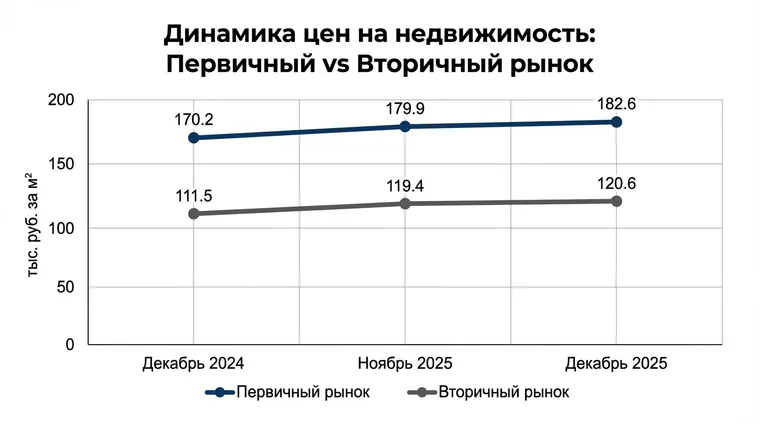
Chart with Russian labels, thousand rubles per m²: December 2024 (170.2; 111.5) and November resale housing (119.4) are approximate calculations from rounded growth rates. November new-build housing (179.9) and December 2025 (182.6; 120.6) are published values from the Sberbank mortgage transaction sample.
What drives housing price trends?
The market's basic ingredients are demand, access to finance, supply, developer costs and buyer expectations. The difficulty is that these factors do not change at the same time.
Factors that have often moved Russian housing prices in recent years:
- Mortgage terms and programme rules. Demand for new housing responds markedly to changes in subsidised programmes and expectations of those changes.
- The key rate and market interest rates. Payments rise, affordable purchase budgets shrink, some demand waits, and some shifts to ‘cash plus instalments’.
- The gap between listing and transaction prices. A wider gap creates room for negotiation. A narrower gap gives sellers more confidence in demand.
- New supply. Fewer project launches have a delayed effect: growth may be modest today, while supply contracts after 1–2 years and supports prices.
- Construction and renovation costs. These rarely cause an immediate spike on a chart, but establish a floor below which sustained selling is uneconomic. This is particularly visible in estimates when materials and work are tracked by property.
Renovation matters too: housing price trends are closely linked to the cost of bringing a property into the desired condition. If you plan to buy a property needing renovation, keep a separate benchmark for labour and materials. We discuss flat renovation costs in 2025 (in Russian) and renovation production costs (in Russian) in separate articles.
What could happen in 2026–2027?
Property forecasts almost always need their qualifications: ‘at these interest rates’, ‘with this inflation’, ‘under these subsidised programme policies’. Understanding the range matters more than predicting one precise point.
In a DOM.RF forecast published by RBC on 24 January 2025, nominal Russian housing prices were expected to grow roughly in line with inflation in 2026–2027. This is a historical, conditional forecast, rather than a confirmed outcome or a promise of today's returns: expensive credit limits demand, making it harder for sellers to raise prices faster than inflation.
The next cycle's risk often lies in supply. If developers launch fewer projects, fewer new square metres reach the market later. This can support prices even with modest demand, particularly where land availability and infrastructure limit supply.
How can you use price trends in decisions and calculations?
As a buyer, keep three figures in view: transaction prices, asking prices and the mortgage rate available for your circumstances. Then examine month-on-month changes. When the market accelerates, opportunities to negotiate narrow. When it pauses, negotiation becomes calmer.
If you treat property as a project—flipping, an investment flat or renovation for rental—price trends become part of the financial model. An ‘average price per square metre’ is no longer enough. You need scenarios for time on market, renovation budget, contingency in the estimate, taxes and commission. Our article on financial accounting for flipping (in Russian) explains why profit emerges only when the figures work together in one system.
This leads to the distinction between price and cost. Revenue can rise without leaving you more money: renovation gets more expensive, deadlines stretch and margins shrink. Basic accounting discipline and clear definitions help. We also have an article on the difference between price and cost.
To track these movements numerically, manage projects by property: budget and actuals, changes to work and materials, contractor agreements and payments. This turns a ‘feel for the market’ into concrete decisions about timing and budgets.
Sources and studies
Materials used for the figures, indices and conclusions:
November study by Domclick and SberIndex (in Russian) (Vedomosti, 11 December 2025): average new-build prices and annual growth. December study (in Russian) (RBC, 22 January 2026): prices of RUB 182.6 thousand and RUB 120.6 thousand, monthly and annual growth rates, and sampling methodology.
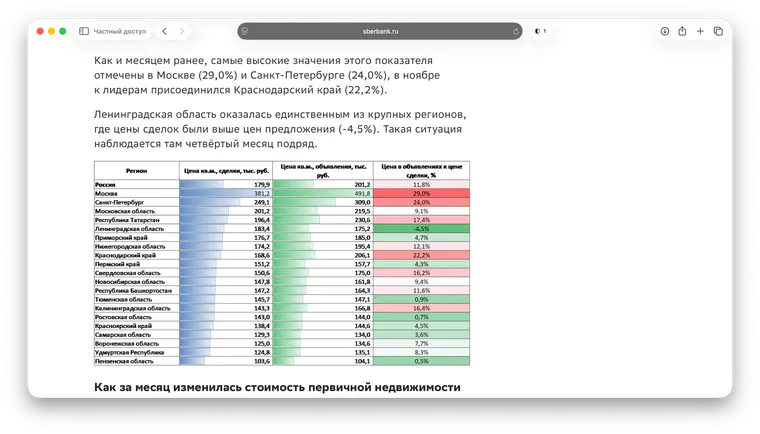
Russian-language source extract: November new-build prices in Russian regions, including differences between asking and transaction prices.
DOM.RF price index (in Russian): slower new-build price growth in spring 2025 and changes since the start of 2025.
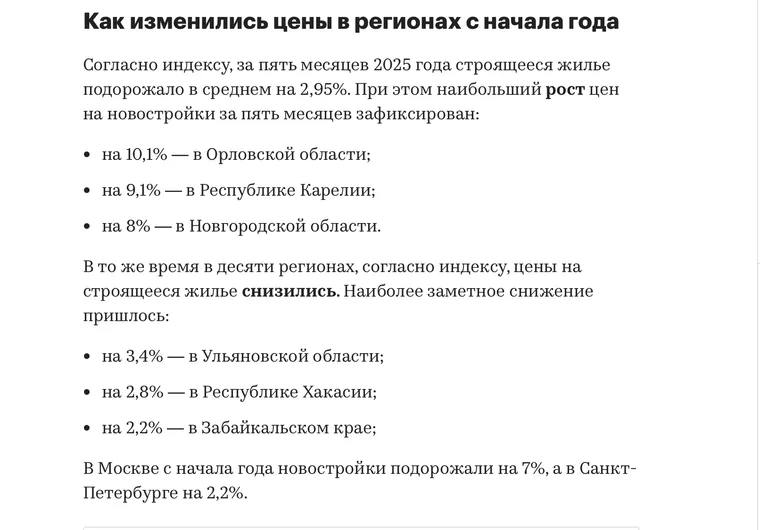
Russian-language source extract: regional DOM.RF index changes during the first five months of 2025.
DOM.RF report and forecast (in Russian) on price growth through 2027 and the reasoning behind an ‘in line with inflation’ scenario.
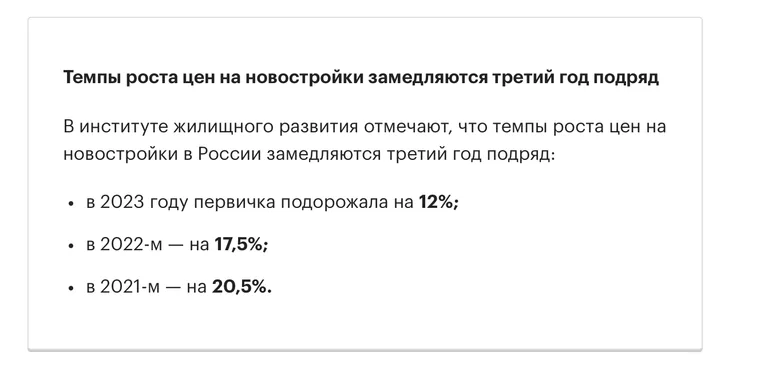
Russian-language historical source extract: new-build price growth of 12% in 2023, 17.5% in 2022 and 20.5% in 2021.
101's article on property market expectations (in Russian), providing context for changes in 2024.
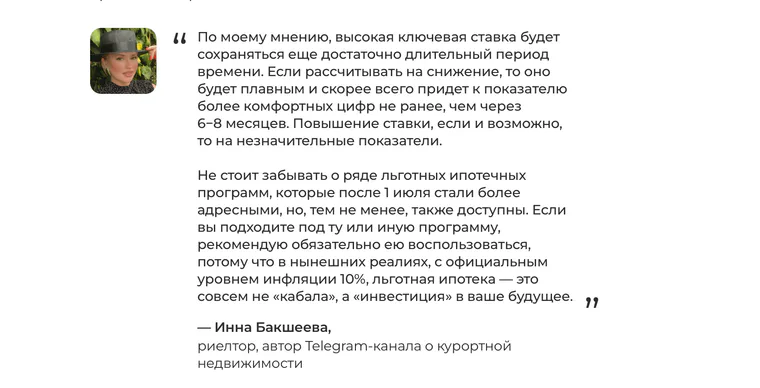
Russian-language extract from a historical 2024 article: Inna Baksheeva's view of interest rates and subsidised mortgages. This is commentary from that period, rather than a current recommendation.