A data-driven approach may sound like a buzzword, but in practice it means managing with greater clarity: decisions are based on data you can verify. Money, schedules, team workload, overdue items and profitability become concrete figures instead of vague impressions.
This approach is particularly valuable in project-based businesses: construction, renovation, agency work, media production and consulting. Every job follows its own course, and without figures it is easy to confuse revenue with profit, or being busy with being effective.
Below, we explain what data-driven management means, which tools it requires and how the 101 app puts it into practice through projects, finances, roles and analytics.
Contents:
What is a data-driven approach?
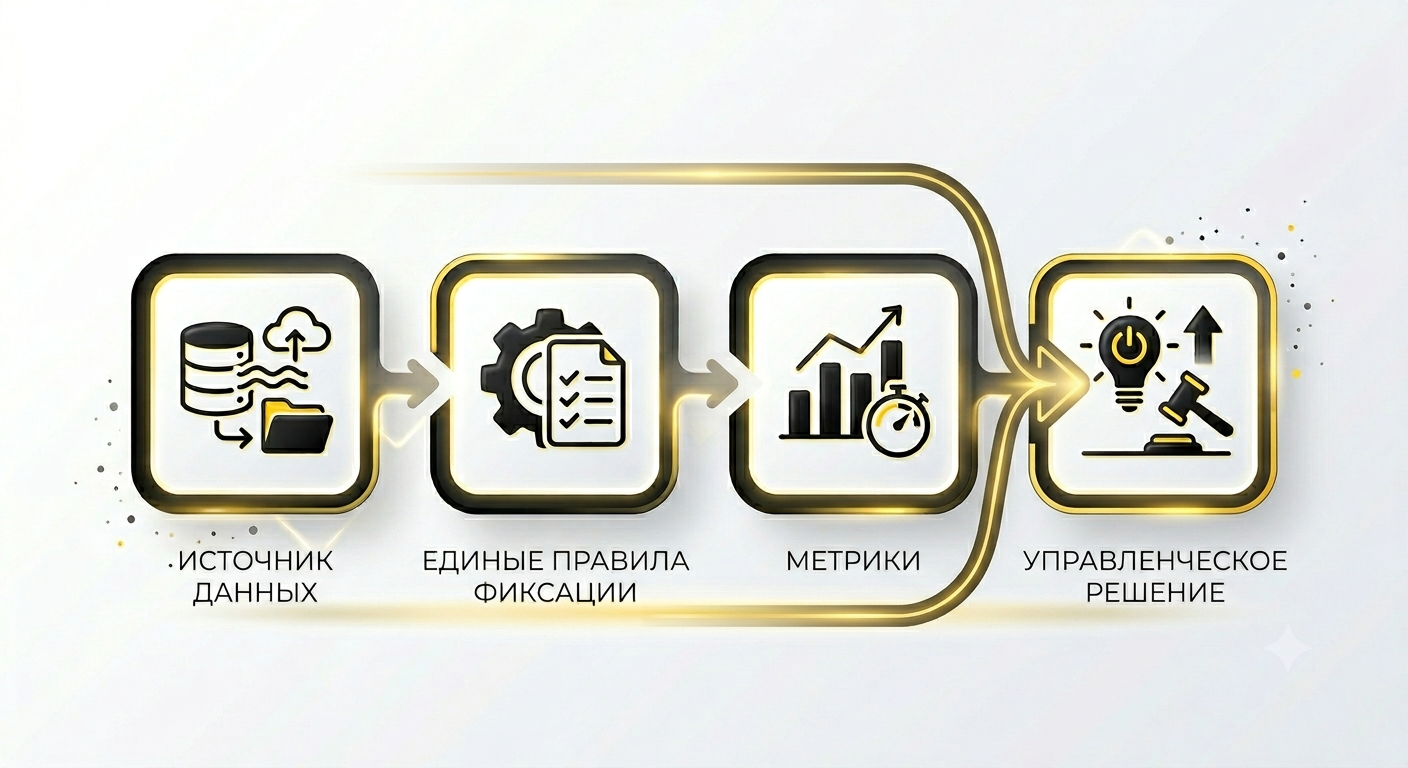
Data-driven management means agreeing on a set of rules within the company: which data to record, where to store it, who is responsible for its quality, which metrics matter most and how often the team reviews them. Managers then use these metrics to make decisions.
Complex analytics is not the point. The value of the approach is that the business stops debating the facts and starts discussing actions: why margins have fallen, where money went, which types of projects are more profitable and which expense categories are growing.
Speed is a key sign of a data-driven culture: something happens, the data enters the system and an insight becomes available. If the figures arrive a month later, decisions are delayed too.
What data do business leaders need?
Collecting data for its own sake does not produce results. In day-to-day management, three layers are usually enough: finances, operational facts and responsibility.
Financial data covers inflows, expenses, debts and funds entrusted to team members. In project-based businesses, figures need to be tracked separately for each job; otherwise, one project can quietly end up financing another.
Operational facts show what has actually happened: work completed, purchases, documents and approvals. They help explain why a project has made a loss: material overruns, rework, additional shifts, missed deadlines and unplanned payments.
Responsibility means knowing who made a decision and who reported on it. When an expense has a named person, category, date and project, the conversation becomes simpler: questions have an owner, checks are quick and conclusions are specific.
What tools are needed for data-driven analytics?
Choose tools according to the task they handle.
The following set is commonly used.
- An operations recording system: money, documents, completed work and counterparties.
- Reference lists and rules: expense categories, roles and consistent formats for comments and documents.
- Storage: a place where data is retained over time without being lost.
- Reports and dashboards: summary views that answer a manager's questions in a minute.
- A review routine: who looks at the figures and when. Without it, even accurate reports become files to deal with later.
If you would like to explore which measures to start with, draw up your own list of metrics and agree on their definitions: what counts as revenue, what counts as profit and where accounts receivable are recorded. Read the 101 blog article on key business performance indicators.
How can you introduce data-driven management?
Implementation most often breaks down at two points: the company tries to collect everything at once, while the team continues working through chats and submits figures late. Start with a manageable scope: agree on recording rules and choose metrics that have a real effect on profit.
Below is a practical plan for construction, renovation and any project-based business.
- Define 5–10 key questions you want the figures to answer. For example: which project generates the most profit, where spending is overrunning, how much company money is held by team members and where a cash shortfall could arise.
- Choose a single source of truth for money and projects. If data is scattered across different places, every meeting turns into a comparison of versions.
- Set up expense categories and agree on rules for entering data. A category, project, date, comment and document form the minimum set for management accounting.
- Assign roles: who records expenses, who approves them and who reviews the project totals. This reduces gaps and forgotten transactions.
- Establish a rhythm: a short review of metrics once a week, and an analysis of variances and decisions once a month. Use project and company analytics that show profit, margin percentages and the expense breakdown.
- Test one management hypothesis: change a purchasing rule, adjust the markup, review incentives and record the effect in figures. At this stage, you assess the financial result of the decision using actual data.
For more on regular analysis, see the article on understanding variances (in Russian).
How does the 101 app support a data-driven approach?
Projects are at the heart of the data-driven approach in the 101 app. Each job or contract is managed as a separate project. Money received and paid out, balances with participants and accrued profit are checked separately: profit is different from the cash balance.
Next comes recording discipline: the team enters transactions and attaches documents to the project within its access rights, and the manager analyses the recorded data. In the mobile app, you can attach photos and documents to reports on work and materials. QR scanning is available for supported Russian fiscal receipts. Loading the item list depends on external data from Russia's Federal Tax Service (FNS), with no guaranteed completion time; you can enter the information manually if it is unavailable. Receipt recognition limitations are explained in the help article (in Russian).
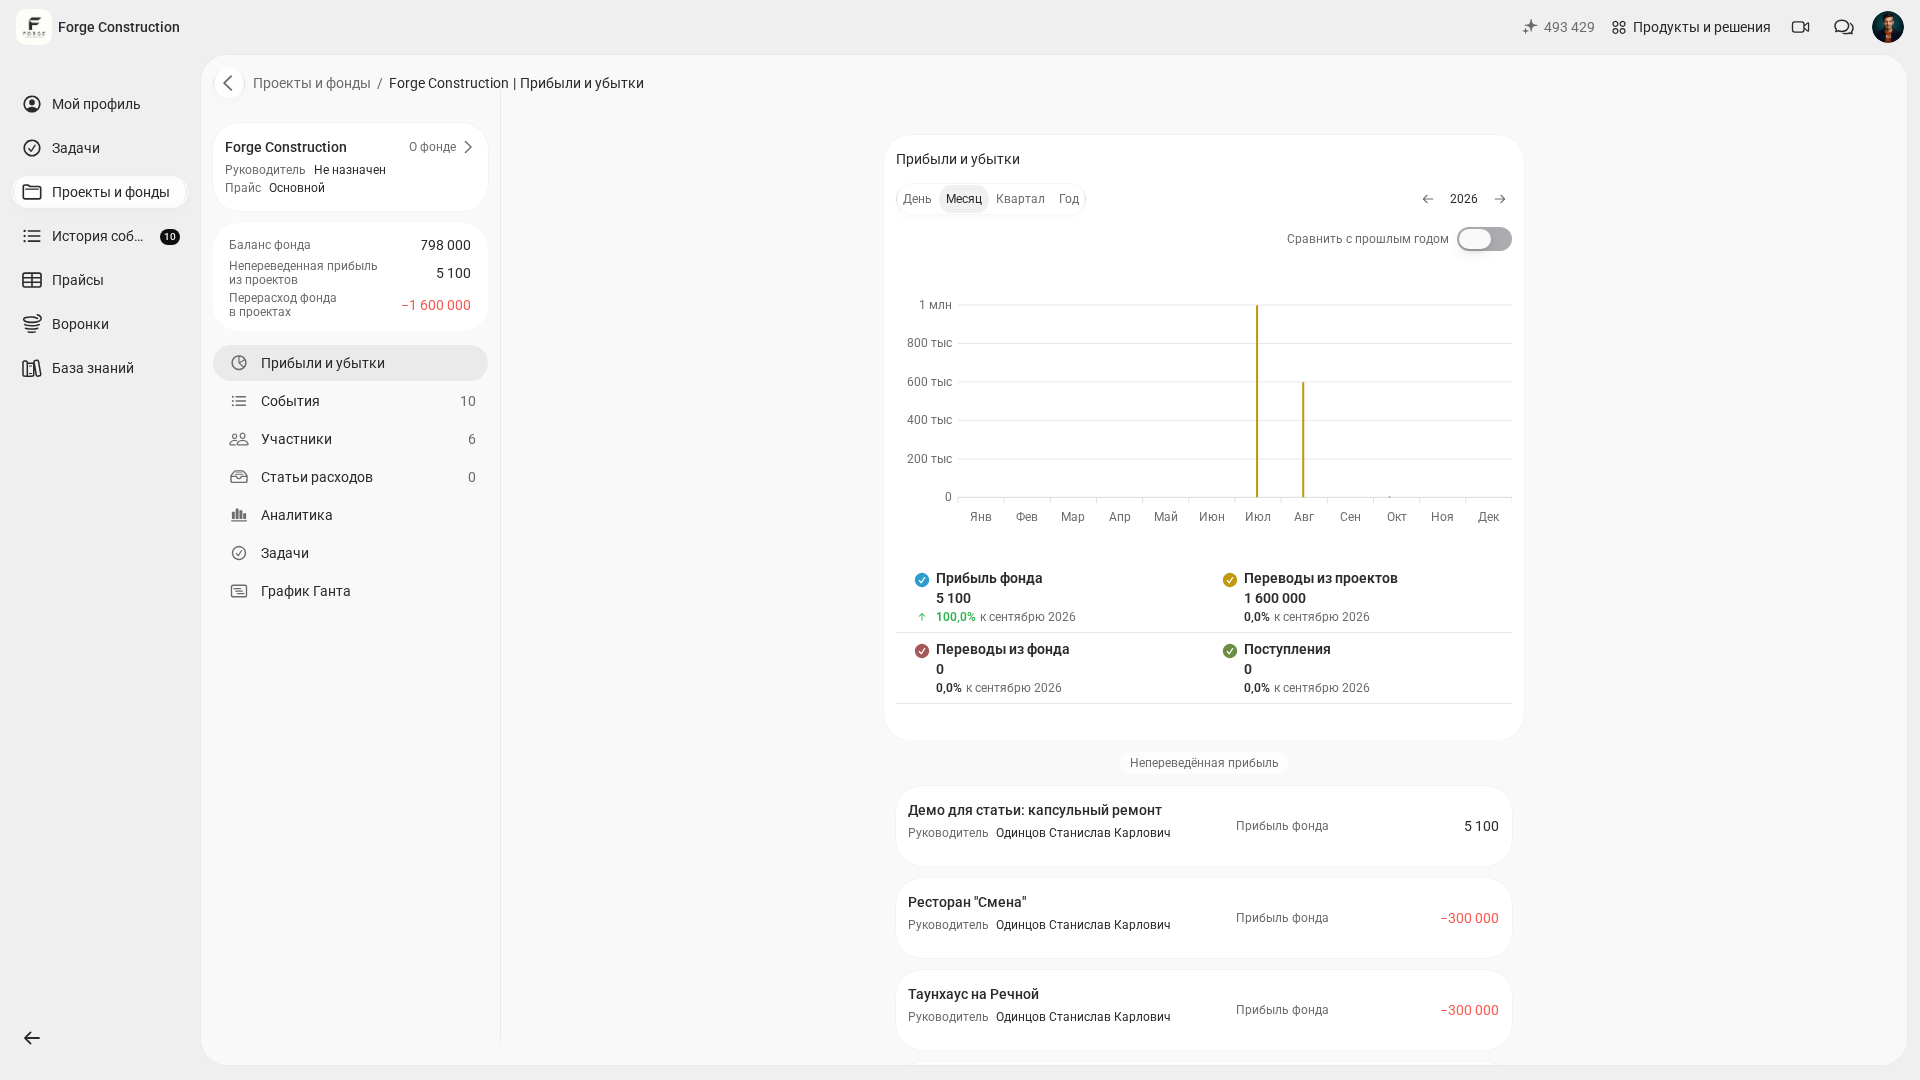
Analytics lets you compare recorded expenses by category and period. Check accrued profit from projects separately in Profit and Loss; profit and the cash balance are different measures. The help article explains how this section works (in Russian).
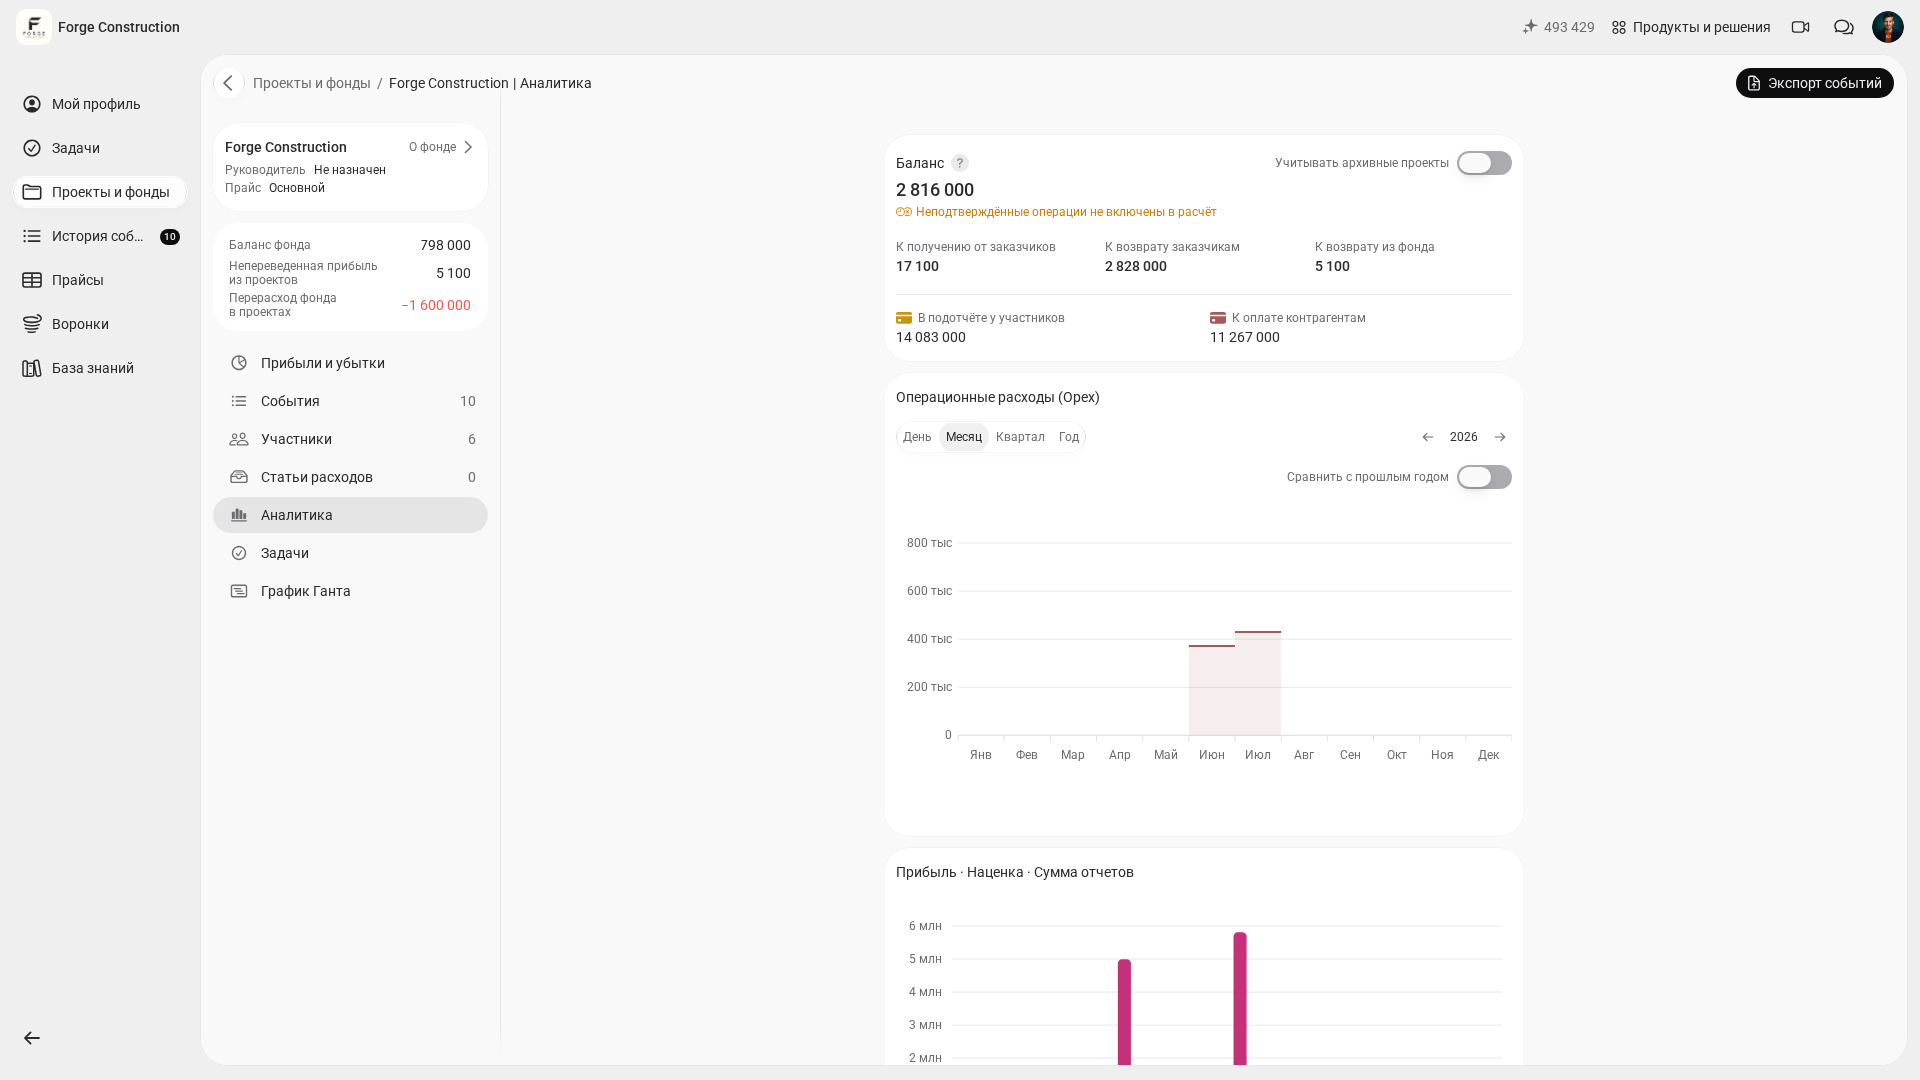
PRO+ includes extended analytics and Company Fund features. Check the current feature set in the Plans section; data visibility also depends on your access rights. Figures are calculated from recorded transactions: assessing net profit requires all expenses and taxes attributable to the period. See the 101 help article for plan conditions (in Russian).
Another benefit for data-driven management is separating expenses by purpose: costs attributable to a particular project and company-wide overhead. In 101, expense categories and the Company Fund help keep project costs and general company expenses separate. Profit accrued from projects and its actual transfer to the Fund are different measures and need to be checked separately.
Common mistakes and data quality checks
A data-driven approach can fail quietly: reports formally exist, yet decisions are still made out of habit. The usual causes are poor data quality and a lack of rules.
These checks quickly show how healthy the system is.
- Data lag: how many days pass between a payment and its appearance in the records. Shorter delays make management more predictable.
- Completeness: are there off-the-books payments or expenses outside the system? If such spending remains unrecorded, project profitability becomes an illusion.
- Consistent categories: watch for duplicates such as Materials, Material and Consumables. The category structure should stay stable.
- Expense allocation: assign a project expense to the relevant project and a general expense to the Company Fund; specify the category and attach available supporting documents. This allocation makes the records easier to check.
To check whether you are already keeping records correctly, use the article on auditing management accounting and common sources of discrepancies.
Would you like to see how data-driven management fits your project and expense structure? You can attend a short product presentation and put together an implementation plan for your team.