In a monthly report, revenue may be lower while profit is higher. Your first impression may be positive, but you should check whether the result is sustainable. Profit changes because of project economics, one-off events, and accounting policies; some causes may coincide with insufficient cash to meet payments.
We will look at what “revenue fell, profit rose” means, how to check the figures, and which decisions to consider in light of available cash and future orders.
To clarify the basic terms, refer to the 101 article on the difference between revenue and profit: it helps you discuss the figures with your team and accounting staff using a shared vocabulary.
Contents:
What does it mean when profit rises while revenue falls?
Revenue reflects the value of work or services recognised over time or at a point in time as obligations are fulfilled, according to the contract terms and the accounting policies adopted. Receiving an advance does not, by itself, mean that revenue has been recognised. An acceptance certificate or another document may confirm the result; the signature date is not a universal recognition date for every contract. This distinction matters in both construction and renovation.
Profit is the difference between income and expenses for a period. Compare the same profit measures for comparable periods. When revenue falls, profit may rise if the relevant expenses decrease by a greater monetary amount than revenue, other income and expenses change, or the previous period included one-off losses that are absent now. Also check for accounting errors.
Consider a hypothetical example: last month, you completed many small projects involving discounts and rework at your own expense. This month, you completed fewer stages, but without rework and with a clear estimate. Revenue is lower. If variable costs fell by a greater monetary amount than revenue, total contribution margin increased. If other operating expenses remain unchanged, operating profit will also rise; a higher margin percentage alone does not establish that.
Which profit measure increased, and how can you check the calculation?
The first step is to establish which profit measure increased: contribution margin, operating profit, or net profit. In a profit and loss statement (P&L), you compare revenue, cost of sales, other operating expenses, and the final result. Contribution margin equals revenue minus variable costs. In a simplified model where variable and fixed cost items include all operating expenses for the same period, subtracting fixed costs from contribution margin gives operating profit. Net profit also reflects financial and other income and expenses, as well as taxes. Direct costs, production costs, and variable costs are different ways of classifying costs; include each item only once in the calculation.
The second step is to check recognition policies. Under accrual accounting, revenue is recorded when obligations are fulfilled or as they are fulfilled, while expenses follow the applicable recognition and period-allocation rules. Buying materials or making an advance payment to a supplier does not, by itself, create an expense for that month: it may create inventory or a prepayment. Match the cost of resources used and the cost of sales to the relevant work and recognised revenue under the policies adopted. Profit and cash receipts for a month can therefore differ.
The third step is to assess operating profit margin: operating profit ÷ revenue; multiply the ratio by 100% to express it as a percentage. The formula applies when revenue is positive; division by zero revenue is undefined. The measure shows operating profit per ruble of revenue. Compare it with the amount of profit and sales volume, because a higher percentage does not guarantee a higher amount. The 101 Blog has a detailed explanation of operating profit margin.
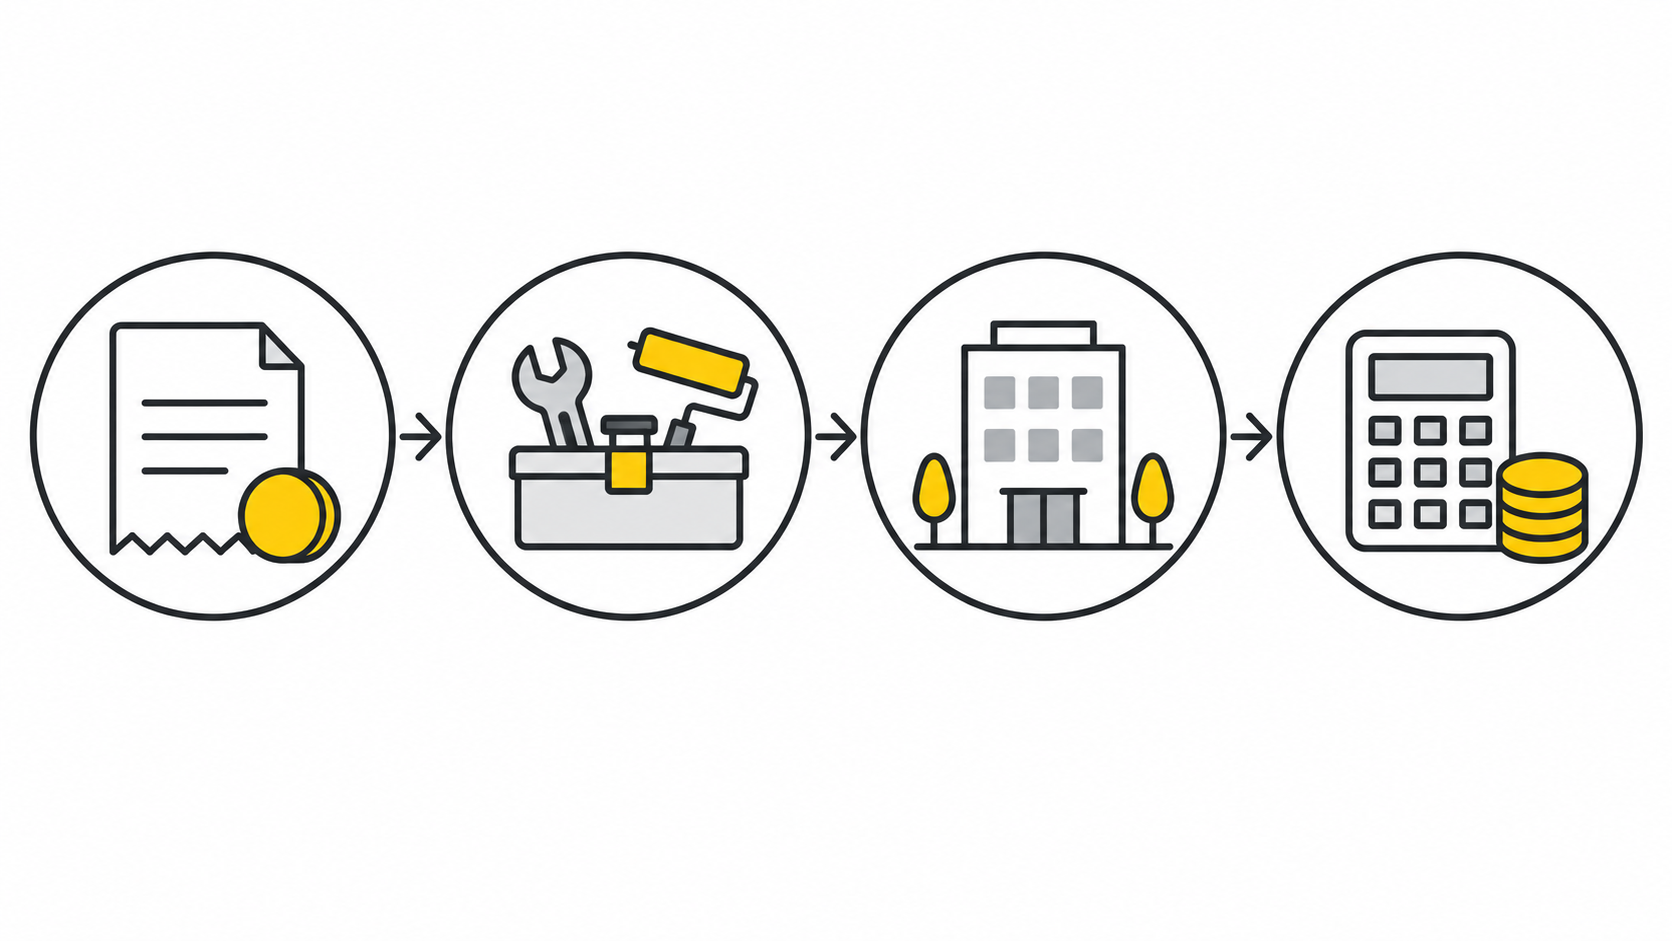
What 7 scenarios could explain rising profit when revenue falls?
Consider seven possible scenarios for rising profit when revenue falls. These are areas to investigate; your conclusion depends on the actual amounts, the profit measure selected, and the accounting policies.
- Project mix and margins changed. More profitable work was completed in the current period, while work with lower margins moved into the following month. Check total contribution margin and other expenses: a higher margin percentage on lower revenue does not, by itself, prove that profit increased.
- Costs fell by a greater amount than revenue. Possible reasons include revised purchasing, less material waste, different contractors, and control of direct costs. Compare the monetary savings with the revenue lost; separately check which costs are variable and which expenses belong to the period under review.
- Fixed costs decreased. For example, you gave up an unnecessary warehouse, revised management pay, or stopped advertising channels that were not generating deals. Assess the actual savings and their effects on quality, delivery of work, and future sales.
- Last month included one-off losses. A penalty, write-off, rework at your own expense, or crew downtime may have reduced the previous result. If those expenses did not arise in the current period, the profit comparison will improve. Check that the expenses are genuinely absent, rather than omitted or incorrectly shifted to another period.
- Other income and one-off results changed. When selling a tool used in the business and recorded as an asset, calculate the result as the sale price minus its carrying amount and the expenses related to the sale. Assess compensation according to its basis and the accounting policies. A refund of an overpayment previously recorded as a receivable from a supplier settles that receivable; it does not automatically create new income. Separate the effect of these transactions on the profit measure selected from cash receipts and revenue from the main business activity.
- Performance, confirmation, and recognition dates differ. Work may have been performed before the customer signed the acceptance certificate. Check when or how the obligations were fulfilled, the contract terms, and the policies for recognising revenue and related expenses. A later signature does not automatically require shifting revenue or leaving the cost of sales in another month. Period-allocation errors can distort the comparison in either direction. For signs of revenue problems, read why revenue falls and what to do (in Russian).
- Costs changed in a business exposed to operating leverage. With positive contribution margin per unit, unchanged prices and unit variable costs, and the same total fixed costs, lower sales reduce operating profit. For profit to rise on lower revenue, another factor must change: for example, management expenses must fall by a sufficient amount. Operating leverage describes the percentage sensitivity of profit to sales under a given cost structure. For more, read the article on operating leverage (in Russian).
Where is the catch?
Rising profit calls for a parallel check of your ability to meet payments. A positive P&L result can coexist with insufficient available cash for current payments.
Consider a hypothetical situation: the P&L shows a profit, the customer has delayed payment for accepted work, materials have already been purchased, and wages are due today. If available cash and financing sources are insufficient to meet mandatory payments, a cash flow gap arises even on a profitable project. The 101 Blog explains cash flow gaps in construction.
Compare three statements: the P&L shows income, expenses, and the result for a period; the cash flow statement shows receipts and payments; and the balance sheet shows assets, liabilities, and equity at a particular date. This comparison applies to construction, renovation, design, and event management when the data and accounting policies are consistent. For details, read the article on the three essential reports for business owners.
Check how much funding your projects need before customers pay. A decline in revenue does not, by itself, prove that your cash buffer or working capital has fallen: payment timing, cash, receivables, inventories, and current liabilities all matter. Net working capital is calculated as current assets minus current liabilities; analyse its composition alongside your payment schedule. Read more in “Working capital of a company”.
What should you do?
Consider two tasks together: checking whether the improvement in profitability is sustainable and identifying the reasons for declining revenue. Assess sales decisions alongside margin, the quality of work, and payment obligations.
For an initial diagnosis, you can choose a working horizon of 30 days, or roughly a month. The time needed and the depth of the review depend on data availability and project complexity; the following eight steps provide a sequence for the work.
- Set a comparable period and accounting policies: revenue recognition, allocation of direct costs to projects, and treatment of shared expenses. Apply the policies consistently. Document changes in methodology and corrections of errors, checking that periods remain comparable.
- Separate contribution margin, operating profit, and net profit. Check which measure increased and use the appropriate cost model without deducting the same amounts twice.
- Identify the reasons by project: which projects generated profit, which changes reduced revenue, and where cost overruns arose. Compare their contribution with the company’s shared expenses.
- Review the path from enquiries through a site survey or meeting and a contract to performing and confirming stages, recognising revenue, and receiving payment. Check revenue recognition and cash receipts separately. If document approval is delayed, set deadlines and assign responsibility; the effect of the delay on the report depends on the contract terms and accounting policies.
- Review direct costs: materials, subcontracted work, and piecework pay. Separately establish which of them vary with volume. Clarify the conditions under which the savings achieved can be sustained and how they relate to work quality.
- Assess how reversible fixed-cost cuts are: which resources you could restore if necessary, and how their absence could affect quality, speed, sales, and delivery of work. For this review, you can consider a horizon of 1–2 months; this is a forecast period rather than a fixed deadline for consequences to appear.
- Prepare a cash flow forecast for the next 4 weeks: customer payment dates, purchases, wages, and taxes. Compare the expected balance and available financing with mandatory payments; test a scenario in which receipts are delayed.
- Choose one action to test revenue growth: contact repeat customers, speed up contract signing, or revise a package of work with a higher margin. Focus on one initiative before launching ten at once; assess its effect and the costs it requires.
How can you keep profit under control?
Data may be kept in chats, notes, and statements, then compiled manually. If the sources use different periods and policies, revenue and expense calculations become incomparable. Consistent data and completeness checks provide a basis for informed decisions.
For a project-based business, it is useful to calculate each project’s financial result separately and then consolidate the results for the company. Record and allocate shared expenses using consistent policies. This lets you check where margins changed, when the conditions for revenue recognition arose, and how the allocation of shared expenses affected a particular project.
The 101 app provides income and expense tracking, project management, and assessment of financial results for projects and the company. According to the published PRO+ subscription terms, the subscription includes financial transaction tracking for projects and the company fund, analysis of financial flows, and company fund financial reporting by individual project. Assess the tool’s capabilities against your own recognition and cost-classification policies.
If you would like to discuss how the system could apply to your projects, you can book a free presentation. According to the 101 website, an expert discusses your company’s needs, demonstrates how the system works, and answers questions. During the meeting, clarify which input data and settings your accounting and profit-analysis model will require.
Rising profit while revenue falls may reflect improved business economics, a one-off result, or an accounting error. Comparing profit measures, projects, the P&L, and cash flows helps you identify the cause and test whether it is sustainable. The time needed for the analysis depends on data quality and completeness. Then assess which changes you can retain and which revenue initiatives are compatible with your target margin, quality standards, and payment schedule.