
Investing in your own business sounds simple: you buy equipment, hire a skilled specialist, spend on advertising, and expect more orders and higher profits. In practice, almost every such investment requires you to weigh risk against expected return.
Business returns are often judged by a feeling: “there is more money” or “the team is faster.” Risk can feel physical, too: one month everything runs smoothly; the next, payments are late and there is no cash. Until those feelings are translated into numbers, decisions can be expensive.
Let us look at how risk and return relate specifically to investment in your own business, from launching a new line of work to spending on accounting, recruitment, and marketing. The focus is on practical checks using your business data, without a detailed review of stock market instruments.
Contents:
- What does the relationship between risk and return mean in business?
- What counts as a return when you invest in your business?
- How do risks lead to cash flow gaps?
- How can you put a price on risk?
- What steps help you make an investment decision within your business?
- How can you reduce risk while preserving expected returns?
What does the relationship between risk and return mean in business?
Investors generally require a higher expected return for taking more risk. This is a requirement used to assess an investment, and it does not guarantee an actual profit. In your own business, uncertainty matters especially for day-to-day operations: money is needed for wages, materials, rent, and obligations to contractors.
Consider a hypothetical example: a company is thinking about buying a machine for RUB 600,000. For illustration, assume that savings on contractors produce an incremental net cash benefit of RUB 80,000 per month after the new ongoing costs have already been deducted. With a steady benefit and no other initial investment, the simple payback period is 600,000 / 80,000 = 7.5 months, less than a year. This calculation does not account for discounting. If the machine stands idle for two weeks, the operator leaves, orders are seasonal, or a customer delays an advance payment, the original forecast must be recalculated: the cash benefit and the time needed to recover the investment may change. Contractor savings before deducting the new costs do not, by themselves, establish that payback period.
It helps to distinguish two things at the outset. The first is “risk taken for growth”: an investment that expands your capabilities. The second is “risk caused by blind spots”: an investment for which the figures have not been collected, controls are weak, and funds are mixed together. Management accounting and disciplined data practices can help address the second category.
What counts as a return when you invest in your business?
The return on an investment in your business is assessed using the result attributable to it, the capital invested, and the period selected. The business’s total net profit “at the end of the year” does not show this on its own. Money leaves today, while the benefit is spread over several months: some appears as time saved, some in margins, and some in operational stability.
Record exactly what you want the investment to achieve. Its financial benefit can be assessed through an increase in incremental cash flow or contribution margin, with the period and comparison baseline stated. Record reduced cash pressure and greater management capacity separately, including the ability to handle more projects without losing quality. These outcomes are useful, but they do not automatically represent a percentage return; to value them in cash terms, explain how they change receipts or payments.
This framework connects to the owner’s core reports: the cash flow statement shows receipts and payments; the profit and loss statement shows income, expenses, and the financial result; and the balance sheet shows assets, liabilities, and equity at a specific date. The 101 blog has a reference article on the cash flow statement, profit and loss statement, and balance sheet.
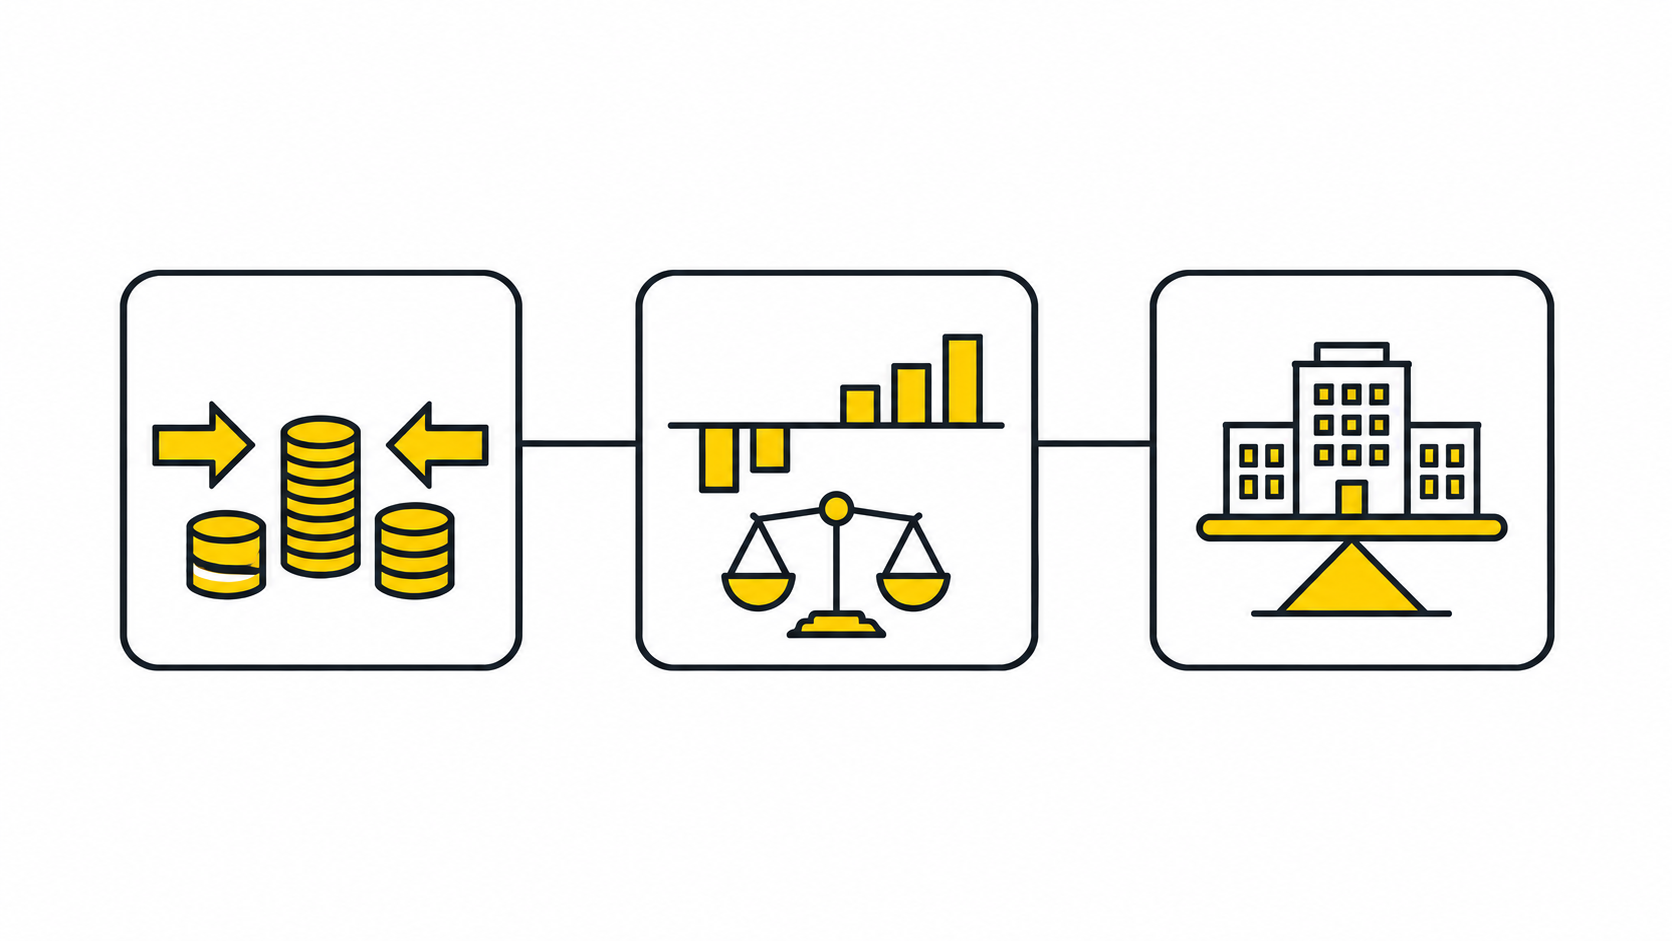
These reports contain specific metrics that help assess investment results. For revenue, there is an introduction to what revenue is and how to calculate it. For project analysis, contribution margin, revenue minus variable costs, is useful. This measure differs from freely available cash in the account: check receipts and payments separately.
How do risks lead to cash flow gaps?
When assessing risk, account for the possibility of a result worse than expected. For the decision, it helps to examine three scenarios: direct losses, a temporary cash shortage, and forgone profit. This makes it clearer which losses need to be weighed against the expected return.
One risk scenario in a project business is a cash flow gap. A contract may be profitable on paper, yet there may not be enough money today to pay for labour and materials: receipts are delayed, while payments are needed sooner. You then have to finance the project with your own funds or borrowing. The article on cash flow gaps shows how this can happen even in a profitable company.
Another common risk is mixing funds: one project brings in money, a second drags the business down, and a third is stuck with unsettled advance payments. Without project-level accounting, this risk remains hidden and there is no basis for managing it.
The third risk is structural. It arises when the share of fixed costs grows while revenue fluctuates. Operating leverage matters here: with positive operating profit, it shows how the percentage change in that profit relates to the percentage change in revenue. A high share of fixed costs can amplify this effect and the risk of losses when sales fall. If this topic sounds familiar, the article on operating leverage in a project business (in Russian) may help.
Once the risks have been described, assess the cash flow and required return that correspond to them. Discounting is used to compare money at different points in time.
How can you put a price on risk?
An investment in a business links money across time: funds are committed now, while the benefit is expected later. Over a longer horizon, account for possible changes: a delayed payment, a change in the scope of work or delivery terms, or rework that reduces the margin. A riskier project generally requires a higher expected return.
Discounting converts future money into its “value today” so that you can compare options without misleading yourself. The 101 blog provides a detailed explanation of discounting cash flows, PV and NPV formulas, and choosing a discount rate.
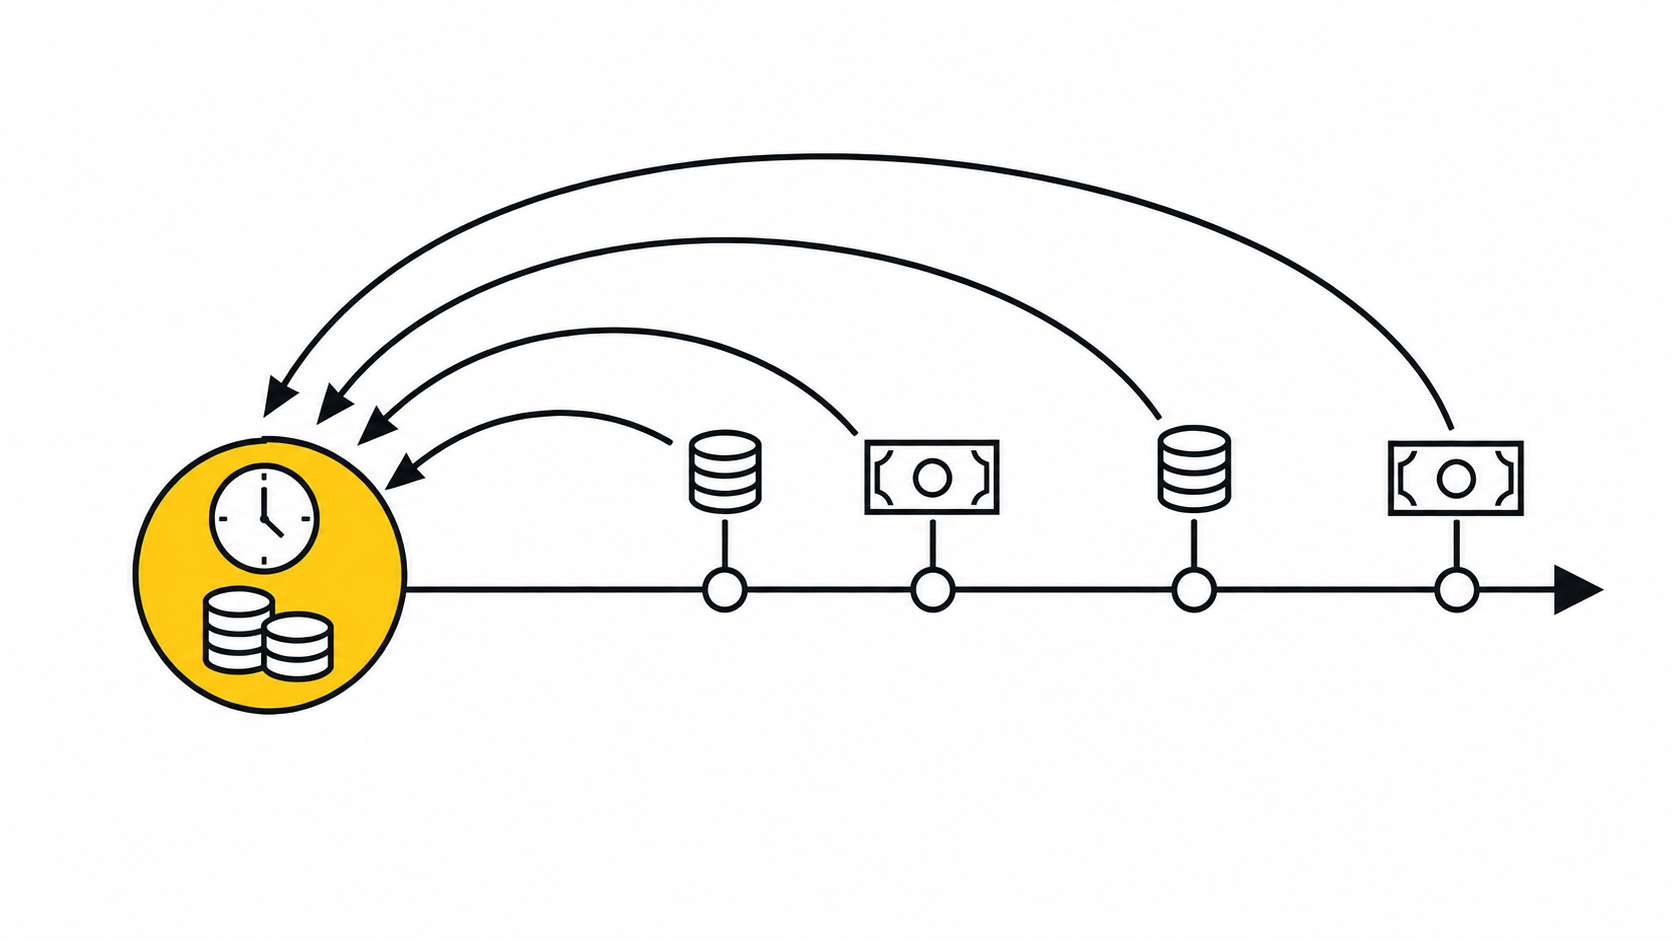
In a practical calculation, choose the discount rate to match the type and risk of the cash flow. The company’s cost of capital can be a starting point if the project’s risk is consistent with it. Borrowing, supplier payment terms, and equity capital have different costs; the rate on one loan does not automatically become the project’s discount rate. A different risk level requires a justified adjustment. Account for specific threats: an unreliable customer, complex logistics, seasonality, and the likelihood of rework. Do not add the same premium again if the corresponding risk is already included in the rate being used. The rate’s period must match the cash flow period.
A useful check is to recalculate NPV using 2–3 justified discount rates and shift receipts by one calculation period. If the model’s period is a month, separately assess the consequences of a one-month payment delay. A sharp deterioration in the result shows sensitivity to the deal’s terms and payment schedule.
What steps help you make an investment decision within your business?
When investing in your business, you can control some conditions: change agreements, stop a project, or redesign a process. The extent of that control depends on the situation. At the same time, concentration risk arises if most of the money depends on one business model and one team; it is worth comparing this with spreading investments across different sources of results.
To compare risk and expected return, you can start with a short set of steps. It is suitable for a preliminary analysis of recruitment, marketing, introducing accounting, and buying equipment. The depth of the calculation depends on the size and complexity of the investment.
- Describe the hypothesis in one sentence: what you are acquiring, what benefit you expect, and over what period.
- Record the baseline: current revenue, margin, team workload, and the bottleneck. If the starting data is insufficient, begin with management accounting for income and expenses: financial accounting for income and expenses.
- Build the incremental cash flow relative to the option of not investing: one-off investments, new recurring payments, expected additional receipts, and savings on payments. A cash flow statement helps monitor cash at any given time.
- Choose the decision metric and assessment period: payback, an increase in contribution margin, a higher cash balance, or fewer cash shortfalls. To assess the return, also specify the investment base.
- Include risk in the assumptions: a delayed benefit, cost increases, and underutilisation. Test the calculation’s sensitivity: a one-month delay, costs increasing by 10–15%, and the benefit falling by 10–15%.
- Set a stopping rule: at what indicator value and by what date will you stop investing or redesign the process?
If the investment concerns customer acquisition, add unit economics measures: CAC (customer acquisition cost), gross profit per unit, and the customer acquisition payback period. This helps assess marketing investments under the chosen model and test its assumptions. The 101 article on unit economics (in Russian) covers this topic.
How can you reduce risk while preserving expected returns?
Reducing risk can improve the financial result through less rework, fewer missed deadlines, and fewer unexpected cash shortages. Compare this benefit with the cost of control measures and the results of alternative investments. Its size depends on the particular business.
The first layer is separate project accounting and cash transparency. When income and expenses are recorded by project, it is easier to check where funds remain tied up in working capital, where advance payments remain unsettled, and where extra work reduces the margin. The 101 App provides project financial transaction accounting and financial report monitoring. Having a tool does not, on its own, guarantee payback: the outcome depends on data completeness and the decisions made.
The second layer is accounting for company expenses separately from project expenses. Marketing, sales, the office, taxes, and services need clear accounting and allocation rules; without them, profitability assessments may be distorted. In 101, the Company Fund is available for general transactions. The published PRO+ offer includes detailed accounting for the fund’s financial transactions and viewing its financial reports by individual project. Check the current subscription terms for the features included.
The third layer is a reserve. A reserve fund is a liquidity buffer that may help cover a temporary cash shortage and give you time to reorganise, including revisiting investment plans. Its usefulness depends on obligations, the cost of maintaining it, and alternative uses of the funds. The 101 blog has a separate guide to building this buffer: the reserve fund.
The fourth layer is analytics. When you can see project profit margins, net profit, and the breakdown of general expenses, it is easier to compare options: where to cut unnecessary costs, where to invest more, and where to change the sales model. The reliability of the conclusions depends on the calculation method and the underlying data. The article on a business analytics system (in Russian) may be useful.
The relationship between risk and return when investing in your business can be expressed as follows: potential losses of money and time must be weighed against the expected result. Accounting, reports, and stopping rules help test assumptions and manage some risks. The actual return still remains uncertain.